You’ve finished the second part of the tutorial. In this, the third and final part, you’ll learn how you can modify a SpotIQ analysis to extend or customize the analysis. You’ll edit an insight to customize the chart it uses or modify the Search syntax behind it.
Customize an analysis
In the second part of the tutorial, you reviewed the first output from SpotIQ. The outlier insights weren’t really that useful. Let’s try to dig deeper into that.
- Scroll down to the outlier section.
- Select the first insight.
-
Choose the menu and select Auto Analyze.
The system responds by starting a new insight run based on the single chart. Each time you request a change to the analysis settings, it starts another run.
-
Return to the SpotIQ page and select your new analysis.

-
Open the analysis and review the analysis details.
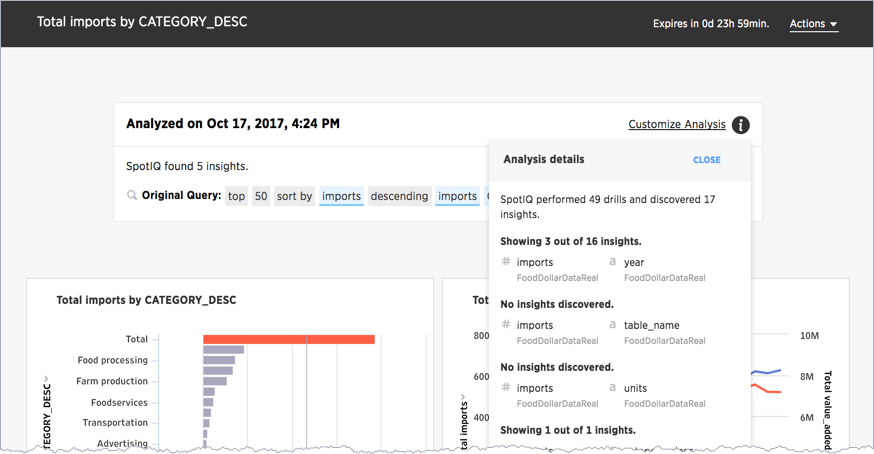
If you recall, the first run against this data SpotIQ ran through 20 combinations and discovered 14 insights. In this second run against one table, SpotIQ ran 49 combinations and developed 17 insights. Only 4 insights were discovered.
Running SpotIQ again does not necessarily result in fewer runs or even, as in this case a reduced number of insights. It changes the analysis though, by selecting the single insight from your first run, you gave SpotIQ information it could use to focus the next run.
Continue with the customization.
-
Choose Customize Analysis.
The Customize Analysis dialog appears.
- Select the Customize algorithms tab.
- Uncheck the Outlier Detection using Z-Score option.
-
Click Trigger Analysis.
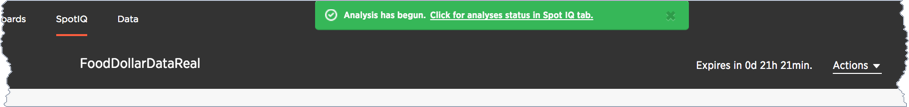
SpotIQ starts a new analysis.
-
Open the new analysis from the SpotIQ page.
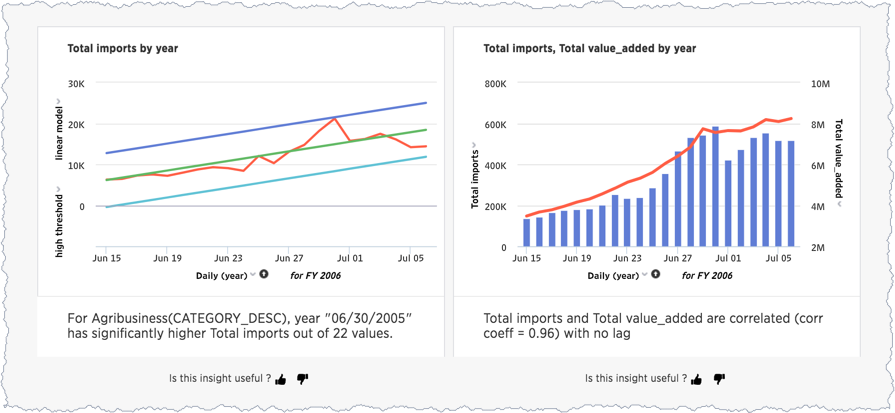
You’ll find that the new analysis has the same name as the last one you ran. The new results include an outlier and a cross-correlation. You’ll discover with these new charts a definite outlier
6/30/2005.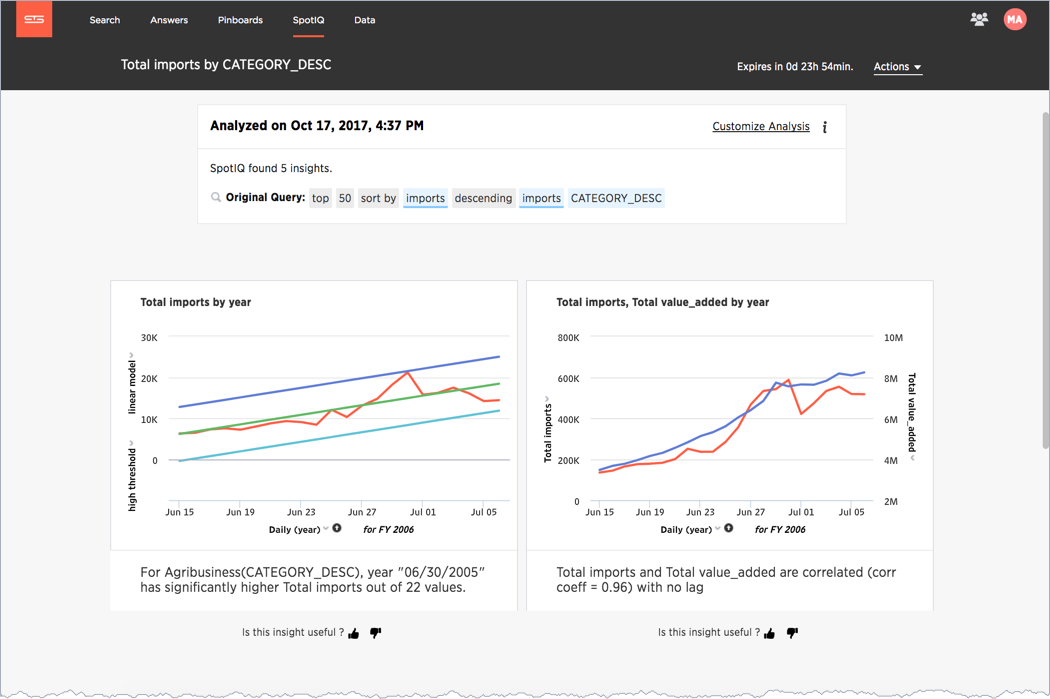
Modify an insight search and visualization
The lines used in the cross-correlation are somewhat ambiguous. A different visualization may help in this case. You can also modify the charts you see in your results. Try this now.
- Select the menu on the Total imports, Total value_added by year chart.
-
Click on the chart menu and choose.Edit.
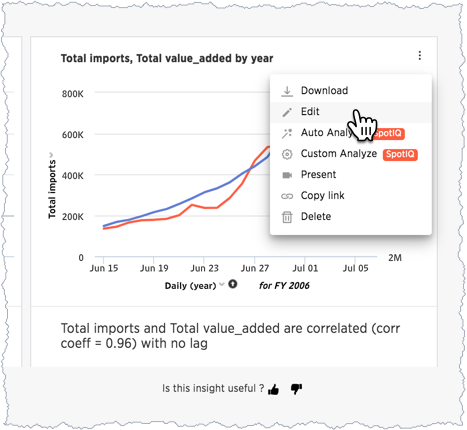
The Edit Visualization appears. The layout is familiar to any user that has run a ThoughtSpot search or worked with a result. This is dialog reveals the Search syntax used to generate the insight. You can use this dialog to do all the things you would normally do with a search.
-
Edit the search bar and remove
table_numfrom the search.The
table_numisn’t strictly necessary in the data.
-
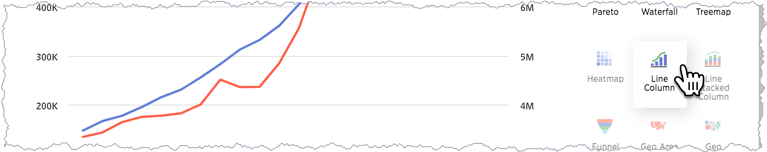
Select the chart icon and choose Line Column to change the visualization.
- Choose Actions > Update.
-
Close the dialog by pressing the X.
The chart with your changes now appears in the SpotIQ list. The outlier stands out very clearly now in both charts.
Present your insights
You can present SpotIQ insights in several ways. You can present an individual result or all of them at once. You can package all the insights in a PDF. This is useful for passing a packet of results. Because any insight an insight into data at a specific point in time, you should always consider saving the insight as a PDF.
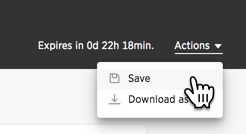
- Locate the Actions menu on the corner of the SpotIQ page.
-
Choose Actions > Download as PDF from the menu.
The system downloads a file containing all the insights. Keep in mind this is file can be very large if there are a lot of insights found in your data.
You can use the Present action to view visualizations that appear in a carousel. can be presented as a group. Present is the best way to To do this, do the following:
- Scroll down to your first carousel with your new charts.
-
Roll over the right corner of the menu to reveal the menu.

-
Choose Present from the menu.
Each individual chart has a Download, Present, or Copy link action you can also take.
Schedule a recurring analysis
If you find an analysis configuration that is useful. You can run that configuration periodically. This is a good thing to do of course as, in a business, data changes all the time.
- Go to the SpotIQ page.
-
Choose the Analysis tab.
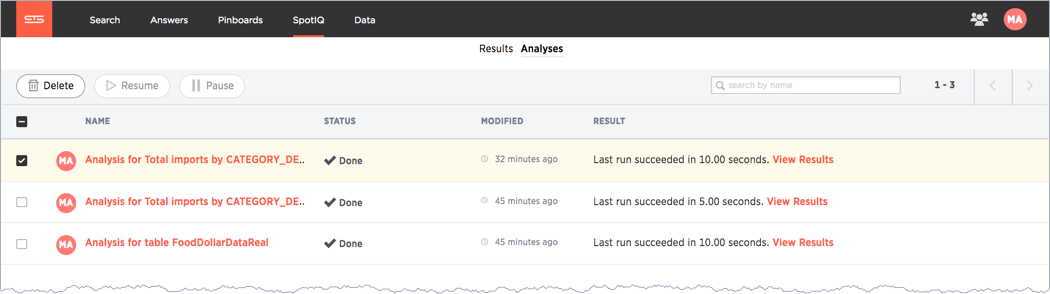
-
Click on the latest Total imports by CATEGORY_DESC analysis.
The Customize Analysis dialog appears.
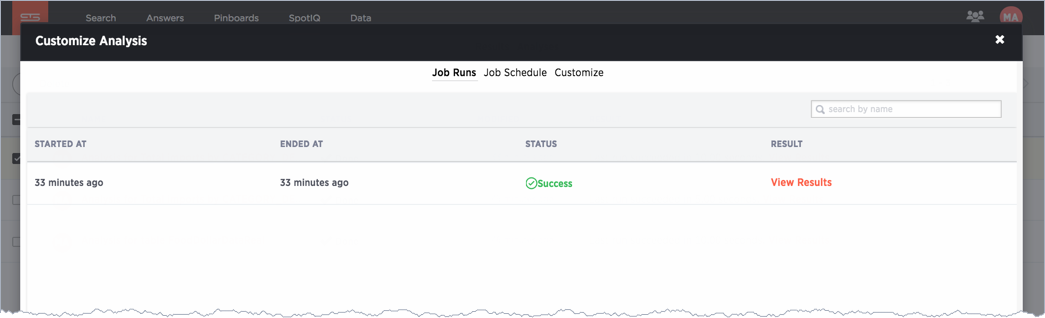
- Choose the Job Schedule option.
-
Fill out the schedule to run the job Monthly.
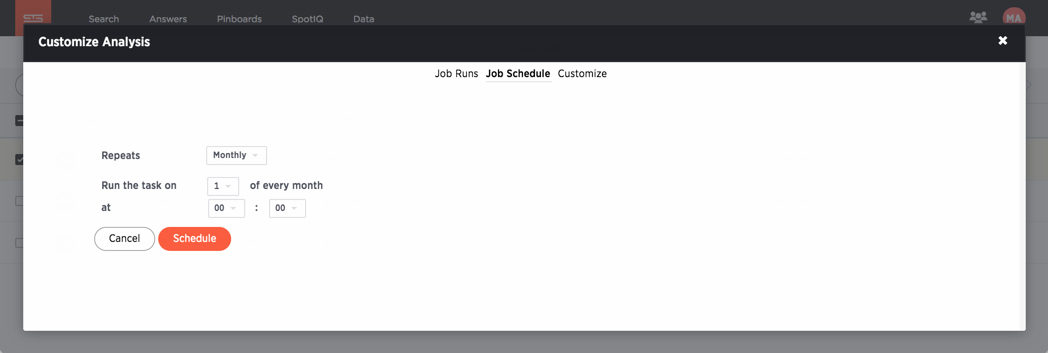
Every month SpotIQ will update your analysis with new data.
Keep in mind that SpotIQ jobs take resources in your system. So, you really don’t want to leave casual jobs running in the system. Go ahead and delete this latest job. Now that you know how to schedule a job, it isn’t needed anymore.
- Check the job you just scheduled.
- Click Delete to remove it.
Congratulations!
Congratulations, at this point you’ve learned the basics of SpotIQ with ThoughtSpot. Throughout the application, you’ll find the SpotIQ icon on search answers, pinboards, visualizations, and data. Wherever you see this option, you can end up on the SpotIQ page, refining your analysis and discovering new insights into your business.