You can configure charts to show the y-axis data values.
Some charts have additional options under Configuration Options that are covered in each chart type topic.
Show data labels
To show data labels:
-
While viewing your answer as a chart, click Edit chart configuration.

-
Select Show Data Labels.

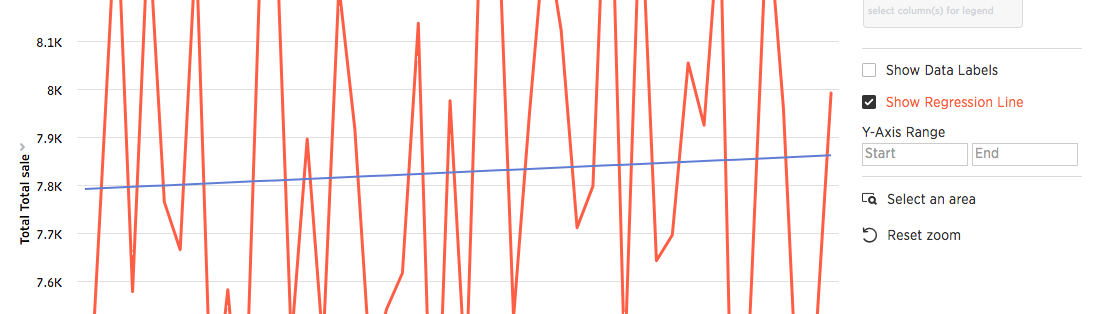
Add regression line
- While viewing your answer as a chart, click Edit chart configuration.
-
Select Show regression line.
 S
S