System monitoring tools in ThoughtSpot include the Control Center, system log files and out-of-the-box system monitoring pinboards.
System Health Center
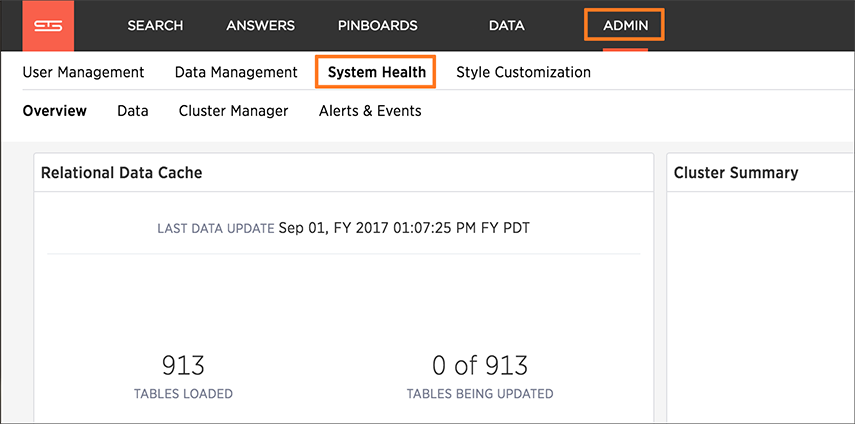
The ThoughtSpot application includes a System Health Center, for easy monitoring of usage and cluster health, including alerts. You can view the System Health Center by clicking on the Admin icon and then clicking System Health.
Overview
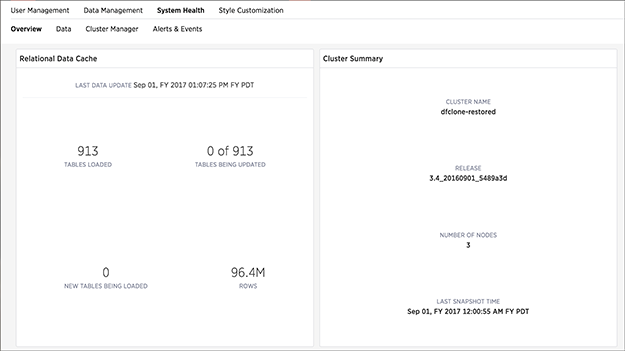
The Overview tab shows a summary of overall cluster status, usage and capacity information, configuration changes, and critical alerts.
Data
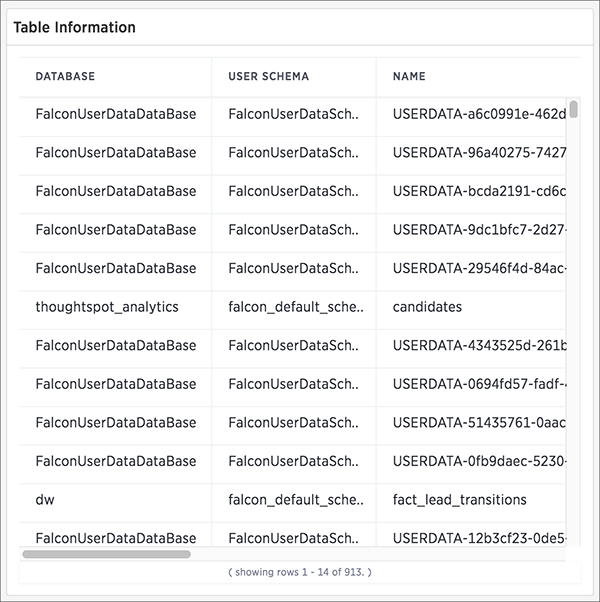
The DATA section shows all the stored tables with details on the last update time, time taken for auto-indexing, number of rows, etc.
The Database section has the following values:
| Section | Status | Meaning |
|---|---|---|
|
Database |
READY |
The data has been loaded. |
| IN PROGRESS | The data is still being loaded. | |
| STALE | The data is not up to date. | |
| ERROR | The table is invalid. Call Customer Support. | |
| Search |
READY |
The data is up to date and searchable. |
|
NOT READY |
The data is not ready to be searched. | |
|
DELETING INDEX |
The table has already been deleted, but the index still exists due to the latency between the database and search engine. | |
| INDEXING DISABLED | Either too many tokens exist in a column for it to be indexed, or indexing has been disabled manually. | |
| CREATING INDEX | The index is being created. | |
| UPDATING INDEX | A change has been made to indexing or the data, and the index is being updated to reflect it. |
Cluster Manager
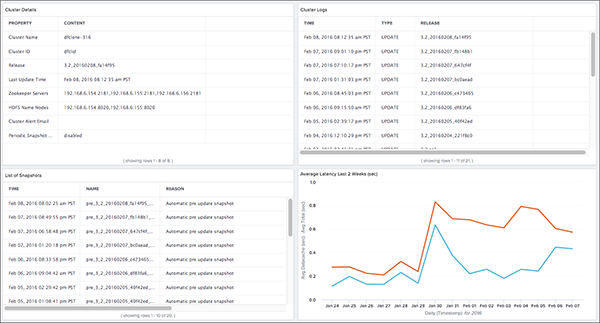
The Cluster Manager section show detailed information about a cluster including latency over time, snapshot status, installed release, node functions, and logs.
Events and Alerts
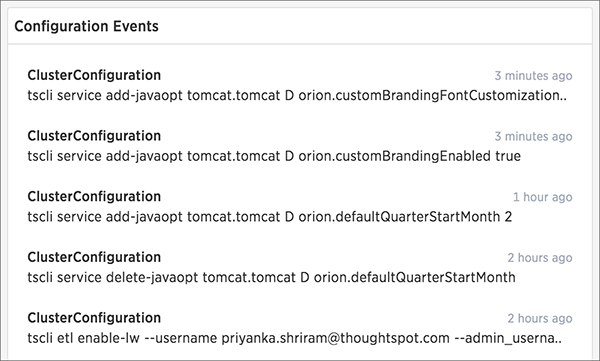
The Events and Alerts section shows notifications, alerts, and an audit trail of cluster configuration changes..
System monitoring pinboards
There are several system monitoring pinboards in ThoughtSpot that include information about the system status and resource usage. The information in these pinboard is updated hourly from an internal database that collects monitoring statistics.
The monitoring pinboards can only be viewed by users with the administrator privilege. They are based on worksheets, which administrators can view, but not modify. The underlying tables are protected system tables that cannot be accessed directly. However, you can create new monitoring reports from the worksheets.
The worksheets for system monitoring are:
- Ts: bi server
- Ts: database
- Ts: loader
- Ts: search
- Ts: service resources
Here is a list of the system monitoring pinboards:
- TS Stats: Usage Helps you see how much the system is being used. Shows search and pinboard activity by user and by date. Examples include:
- Questions asked by user
- Questions asked by date
- Pinboard impressions
- TS Stats: Suggestions Helps you monitor the performance statistics for the suggestions provided in the search bar. Shows the number and latency of suggestions given over time. Examples include:
- Suggestion volume over time
- Suggestion latency over time
- TS Stats: Queries Helps you monitor database performance over time by showing query volume, latency, and any errors. Examples include:
- Query latency by size of response
- Average vs. maximum query latency
- Database queries and errors
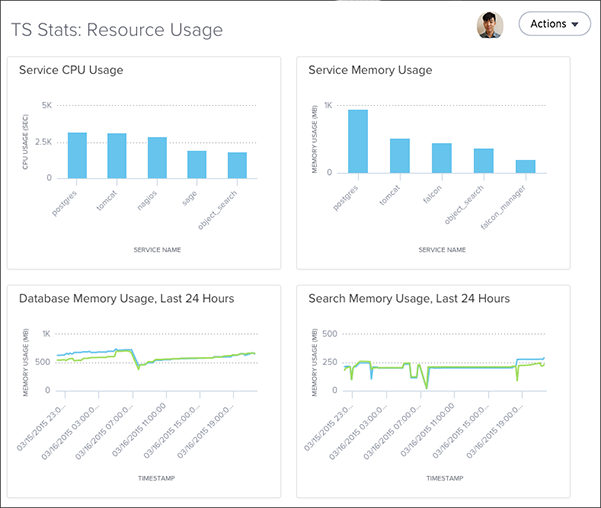
- TS Stats: Resource Usage Helps you monitor cluster resources by showing memory and CPU usage per component:
- Service
- Database
- Search
- Host
- Aggregate (all)
Examples include:
- CPU usage per component over time
- Memory usage per component over time
- Aggregate memory usage over time
Log files
Many of the administration commands output logging information to log files. The logs get written into the fixed directory /export/logs, with a sub-directory for each subsystem. The individual log directories are:
/export/logs/orion/export/logs/oreo/export/logs/hadoop/export/logs/zookeeper
System monitoring notifications
You can configure ThoughtSpot to send emails to addresses you specify with monitoring reports and a cluster heartbeat. Follow these steps to Set up monitoring.