Creating a pivot table enables exploring alternate visualization of data in a wide table. The basic idea is that some data is easier to consume when laid out horizontally, while others, vertically. Pivot tables are a chart time typat use a drag-and-drop interface.

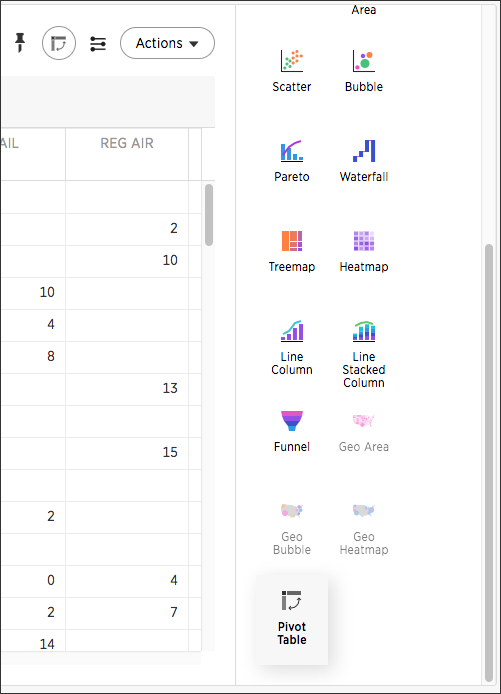
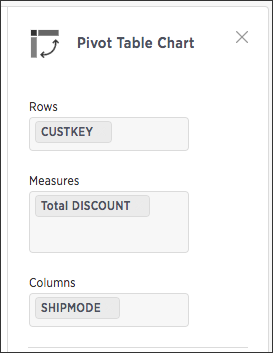
Choose Pivot Table under Select Chart Type to view your search as a pivot table. Add rows, measures, and columns to the search bar and restructure your table by moving these values under Configure Chart or by dragging and dropping them.

Some additional details about pivot tables include:
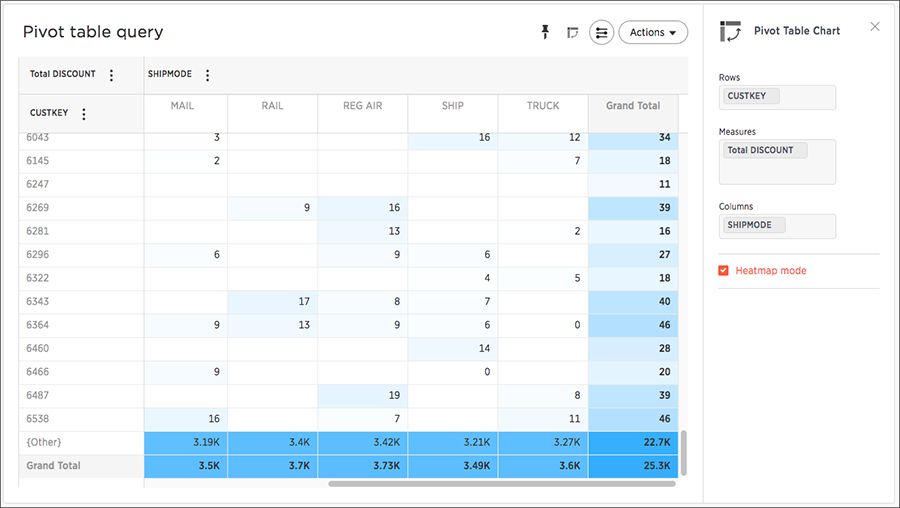
- Pivot tables show the grand totals for columns and rows.
-
You can toggle on the Heatmap mode found under Configuration Options to add color coordination to your data.

-
Click a column or row to expand it. Additionally, you can expand or collapse all by right clicking the arrow on the top left of a cell.

- When you pin a pivot table to a pinboard, it will retain your expansion settings.
The pivot table chart type has these limitations:
- Only the first 10,000 data values will be used. If you would like to increase this limit, please contact ThoughtSpot Support.
- Pivot table is not available if the dataset contains more than 100,000 rows.
- Columns with cardinality beyond 100 are grouped into {Other}.
- Show underlying data menu is unavailable.
- Conditional formatting is not functional.