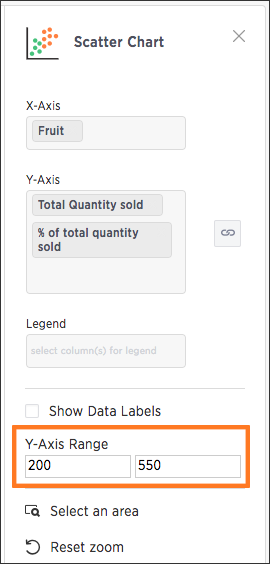
You can manually set the y-axis range by using the Edit chart configuration icon. The chart configuration panel includes the option to manually set the y-axis range. To set the y-axis range:
-
While viewing your answer as a chart, click Edit chart configuration near the top right.

-
Under Y-Axis Range enter your preferred start and end values.

Your chart will reorganize itself to reflect the new y-axis range.