Admins and users with the Has SpotIQ privilege can run an R script using the Custom Analysis feature of SpotIQ. This means you can run an R script from any point in ThoughtSpot where you find the Custom Analysis menu option.
The R language is an open source programming language used for statistical computing. As such, knowledgable users can use R to perform sophisticated analysis in a ThoughtSpot environment.
This section explains the feature and how to use it. It is not meant as an R primer. To learn more about R and how to use it, visit the (R Project for Statistical Computing)[https://www.r-project.org/].
Understand R script requirements in ThoughtSpot
ThoughtSpot provides R running as a service within a ThoughtSpot cluster. Permissions are restricted. This means the R script does not have permission to system commands.
The ThoughtSpot cluster has pre-installed the basic R packages. If your script requires a specific package, you may request your Thoughtspot cluster admin to install the package on your behalf.
ThoughtSpot internally transforms and binds an R script prior to sending it to the cluster’s R service. The system expects each script have a well-defined structure which is the following:
####R SCRIPT####
<Fill script body>
####COLUMN BINDINGS (ONE PER LINE)####
<Fill column bindings here>
The scripts contains the column bindings with the answer results appearing as parameters
in the R script. ThoughtSpot expects for each .paramn in R your script must
provide a corresponding binding. The following pseudo code illustrates an R
script in a form suitable for ThoughtSpot:
####R SCRIPT####
df <- data.frame(.param0,.param1, ...);
...
write.csv(..., file=#output_csv#, ...);
Notice that .param0 refers to first column in column binding and .param1
refers to the second. Should you need a third binding, you would use .param2
and so forth.
The output of the script is either PNG or CSV. This example script uses
#output_csv# to emit data in a CSV (tabular) format. Use #output_png# to
emit data in PNG format.
Presently, error reporting is limited for R scripts in SpotIQ. You should validate your R script independent of your ThoughtSpot environment. Once you are sure they are free of syntax or other errors, then try the script in ThoughtSpot.
Try a Custom Analysis with R
The following illustrates how to run an R analysis on data that has a sales column and a zip code column.
- Log into ThoughtSpot and go to the Search bar.
- Use Choose Sources to locate a source with sales and zip code data. This example uses Phone Sales data.
-
Enter
sales zip codein the search bar.If your source contains the proper data, you should see something similar to the following:

-
Choose Actions > Custom Analyze.
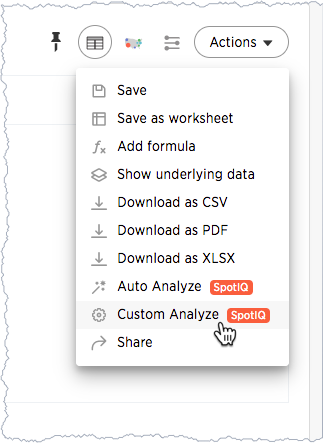
ThoughtSpot opens the Customize Analysis dialog.
- Choose the Customize algorithms tab.
-
In the Select Algorithms section, click the Custom R Script box.
Selecting this option unsets all the other options on this tab and displays the Refine Parameters field.
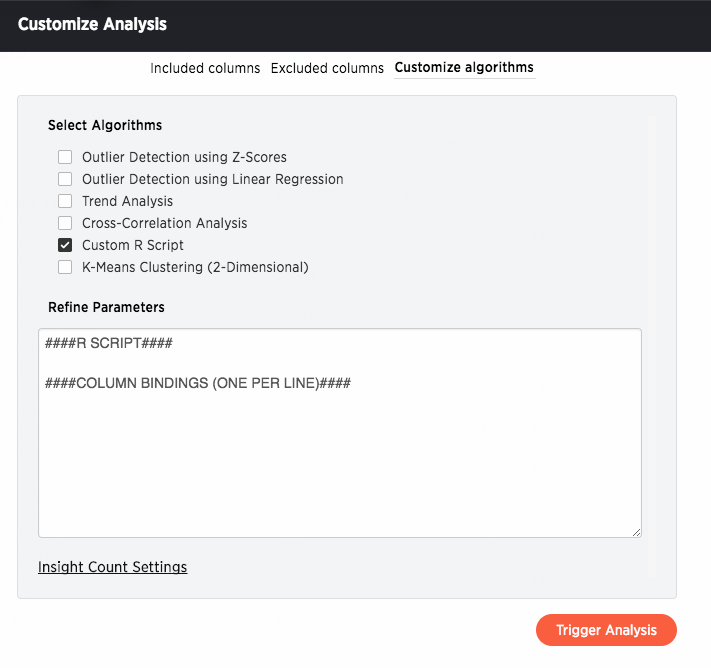
-
Enter this sample script in the field.
 ####R SCRIPT####
 library(ggplot2)
 set.seed(20)
 df <- data.frame(.param0, .param1)
 cluster <- kmeans(df[1:2], 3, nstart = 20)
 cluster$cluster <- as.factor(cluster$cluster)
 png(file=#output_png#,width=400,height=350,res=72)
 print(ggplot(df, aes(.param0, .param1, color = cluster$cluster)) + geom_point())
 ####COLUMN BINDINGS (ONE PER LINE)####
 Sales
 Zip Code
This script binds
.param0toSalesand.param1to theZip Codecolumn. You can see from the script that the output should be PNG (#output_png#). -
Check your work.

-
Click Trigger Analysis.
SpotIQ runs your analysis in the background.
-
Go to the SpotIQ page and click on the results of your newly triggered analysis.
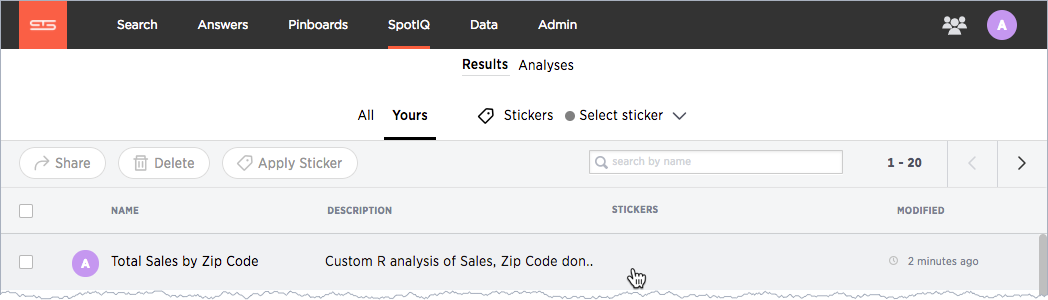
You should see the results in PNG format similar to the following:
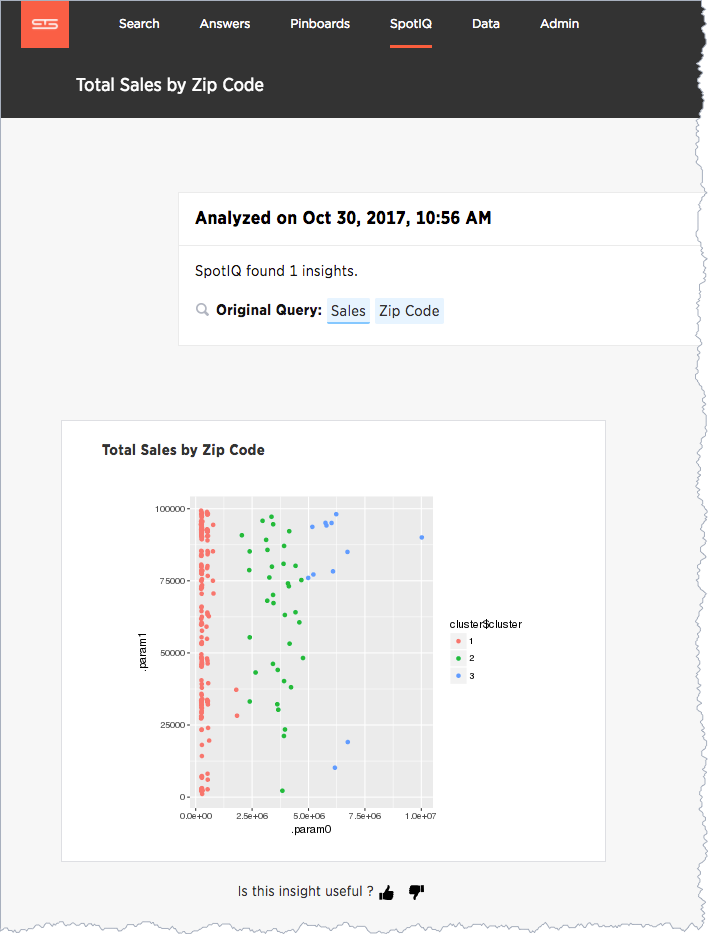
You can run another R script directly on this result to get CSV results. Try this on your own. Here is the script to give you CSV output:
####R SCRIPT####
set.seed(20);
df <- data.frame(.param0,.param1);
cluster <- kmeans(df[1:2], 3, nstart = 20);
df$Cluster <- as.factor(cluster$cluster);
colnames(df)[1] <- 'Sales';
colnames(df)[2] <- 'Zip Code';
write.csv(df, file=#output_csv#, row.names=FALSE);
####COLUMN BINDINGS (ONE PER LINE)####
Sales
Zip Code