Your search answer (results) have various display options. You can change the visualization used to display your results, their sort oder, and how they are grouped or grouped.
Change the view
You can change the view of your answer so it appears as a table or a chart. To change the view of your answer:
- View your answer.
- Click Change Visualization.
-
Select either table or a chart type.

Sort your search
Sorting your search allows you to order your answer, making it easier to read. To sort your search:
-
If you are in the data (table) view, click the column header you would like to sort on.
By default, sorting applies in descending order. You can click on a column header to sort again to sort in ascending order.
Tip: Hold shift and click another column to add a secondary sort. You can even add tertiary sorting and so on by continuing to use this trick. -
If you are in the chart view, click the axis label of your chart and select Sort.
Change the date bucketing
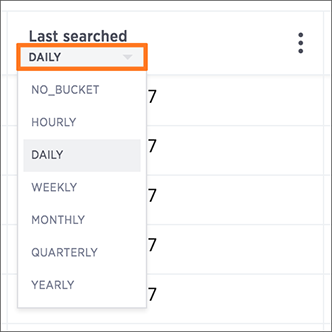
The default date bucketing takes the entire search result into account. For example, if your search includes last month, dates are bucketed daily instead of monthly. You can change the date bucketing on tables and charts for columns with date values. To change the date bucketing:
-
Click the date bucket dropdown on the column header of your table or on the axis label of your chart.

-
Select a different date bucket.
Exclude and include row values
You can include or exclude row values from your answer.
To exclude or include row values:
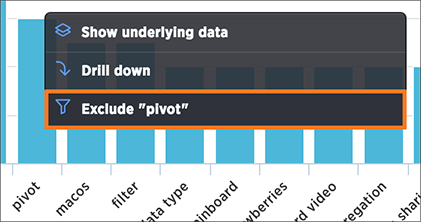
- Right click on the visualization or table cell of interest
-
Select Exclude “value” or Include “value” if available.
