If you need more information in order to troubleshoot ODBC connections, you can enable logging for ODBC on the workstation you use for connecting to ThoughtSpot. There are two points where you can enable logging:
- the workstation where you run your ETL activities
- the server where the Simba service is running
On both workstation and servers, the verbosity of the log is controlled by the
LogLevel property. This property can be one of the following:
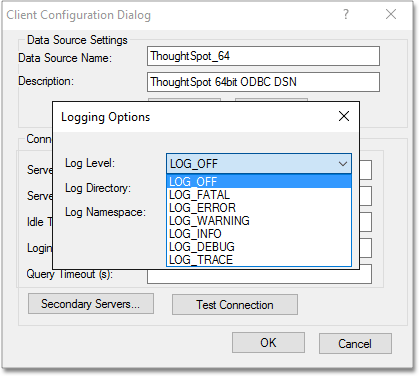
0orLOG_OFF: no logging occurs1orLOG_FATAL: only log fatal errors2orLOG_ERROR: log all errors3orLOG_WARNING: log all errors and warnings4orLOG_INFO: log all errors, warnings, and informational messages5orLOG_DEBUG: log method entry and exit points and parameter values for debugging6orLOG_TRACE: log all method entry points
Larger values include the information from lessor values. For example, if you
set 3 or LOG_WARNING, you log all warnings and all errors.
Enable ODBC logs on a Windows workstation
To enable ODBC logs on Windows:
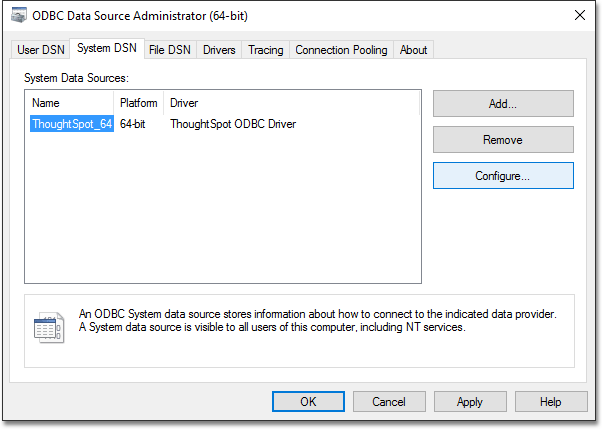
- Open the ODBC Data Source Administrator and select the System DSN tab.
-
Select your ThoughtSpot data source and click Configure.

-
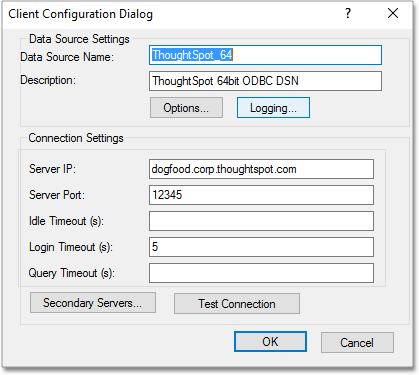
In the Client Configuration Dialog, click Logging.

-
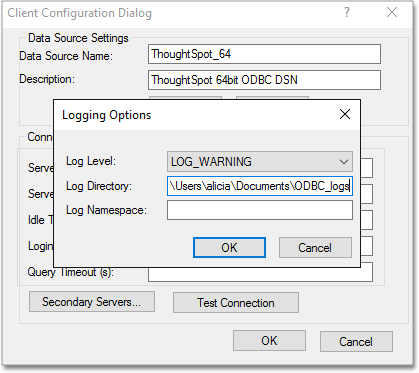
Choose a Log Level, depending on what level of verbosity you want to show in the logs.

-
For Log Directory:, type in the fully qualified path where you want the logs to be saved.

- Click OK to save your settings, and OK again, to dismiss the ODBC Data Source Administrator.
- Run the ODBC load.
- Locate the log file that was generated, and send it to ThoughtSpot Support with a description of the problem.
Enable ODBC logs on a Linux workstation
To enable logging on Linux, follow these instructions:
- Navigate to the directory where you installed ODBC.
-
Open the
odbc.inifile in a text editor.This file is the registry and configuration file for ODBC.
- Locate the
LogLevelandLogPathproperties. - Uncomment the properties.
-
Enter a value for the
LogLevelthe.Acceptable values are from 1 to 6 with 6 being the most verbose.
-
Enter the fully qualified path for the
LogPathvalues.The log will be written here. Your file will look similar to the following: Example for Linux 64-bit:
[ThoughtSpot] Description = ThoughtSpot 64-bit ODBC Driver Driver = ThoughtSpot ServerList = 172.18.231.17 12345 Locale = en-US ErrorMessagesPath = /home/admin/linux/ErrorMessages UseSsl = 0 #SSLCertFile = # Set the SSL certificate file path. The certificate file can be obtained by extracting the SDK tarball LogLevel = 3 # Set log level to enable debug logging LogPath = /home/admin/odbc-logs # Set the debug log files path DATABASE = # Set the default database to connect to SCHEMA = # Set the default schema to connect to - Save and close the file.
- To test the configuration, run the ODBC load and review the log files.
Control logs from the Simba server
You may want to collect logs from the Simba service. Do the following to procedure on every ThoughtSpot node running the Simba service.
- SSH into the ThoughtSpot node.
-
Edit the
/etc/thoughtspot/linux.inifile.... [Driver] ## Note that this default DriverManagerEncoding of UTF-32 is for iODBC. unixODBC uses UTF-16 by default. ## If unixODBC was compiled with -DSQL_WCHART_CONVERT, then UTF-32 is the correct value. ## Execute 'odbc_config --cflags' to determine if you need UTF-32 or UTF-16 on unixODBC DriverManagerEncoding=UTF-32 DriverLocale=en-US ErrorMessagesPath=/usr/home/linux/ErrorMessages/ LogLevel=0 LogNamespace= LogPath= .... -
Uncomment the
LogLevelsetting.The
LogLevelis the level of logging to capture (0-6). -
Set
LogPathto a directory to save the logs.The
LogPathis the fully qualified path where ThoughtSpot should write the logs. -
Work with ThoughtSpot Support to restart the Simba serivce.
The node IP may change because of the restart. If this happens, repeat the entire procedure.