At this point, you completed the first set of SpotIQ tutorial tasks, you uploaded some data, and ran your first SpotIQ analysis. You can look at the SpotIQ list and see when your analysis ran. This is important knowledge because as data changes over time, we continue to analyze it.
In this section, you look at the results and see what insights SpotIQ discovered. Learn about the basic types of analysis SpotIQ runs on data.
View results of an analysis
- If you haven’t, log in to the ThoughtSpot application.
- Select the SpotIQ > Results page.
-
Look for results from your FoodDollarDataReal analysis and click the NAME. The application opens the SpotIQ insights.
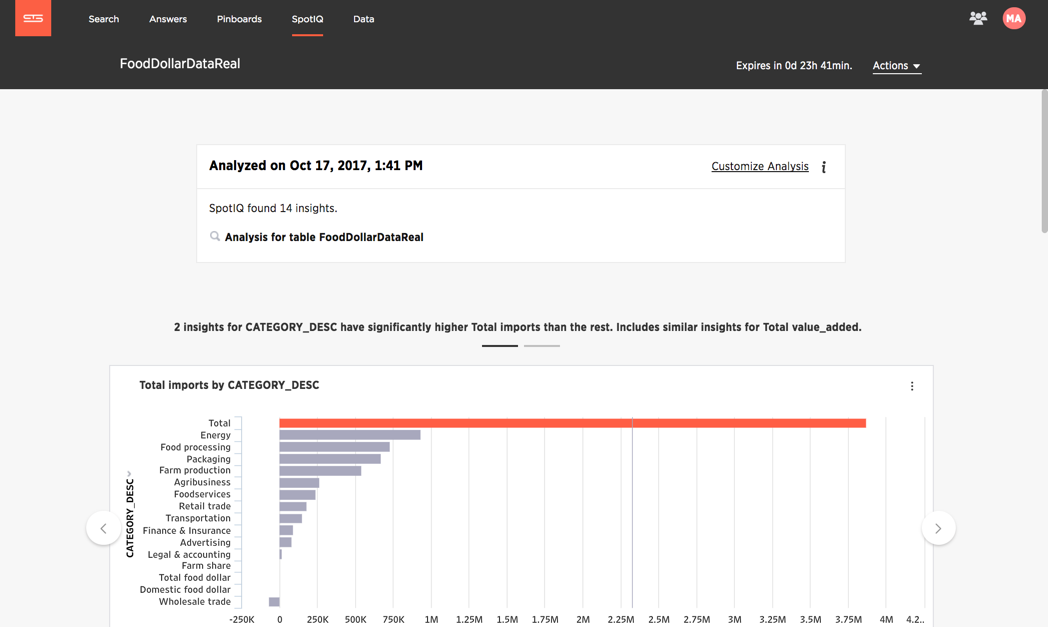
The first panel provides information about the analysis.
-
Click the information icon
 at the top of the page to see a summary of the SpotIQ analysis.
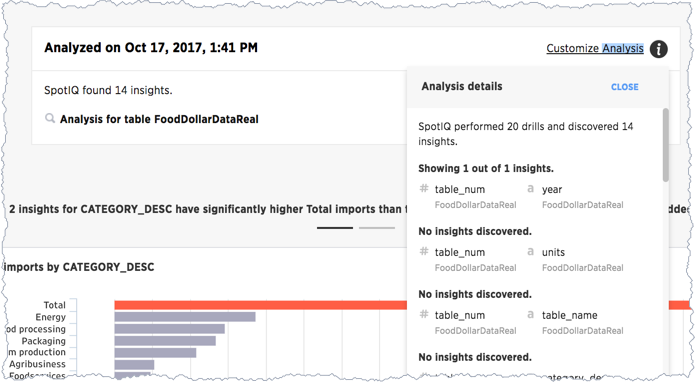
You can tell that SpotIQ ran through 20 combinations and discovered 14 insights. The first looked for an insight in a combination of the
table_numandyearcolumns in the FoodDollarDataReal data and discovered one insight. The next to column combinationtable_numandunitsdid not reveal any insights. -
Close the details panel and look at the corresponding insight SpotIQ produced.
You can see that SpotIQ found three sets of insights:
- 2 insights for CATEGORY_DESC have significantly higher Total imports than the rest. Includes similar insights for Total value_added.
- Insights from Cross Correlation Analysis.
- Insights from Trend Analysis.
There is a reason there are three sets. Learn the answer to that later.
Time and your insight data
Notice that when you first look at an insight there is an expiration date in the upper right corner:

If the expiration time elapses, ThoughtSpot automatically removes the reports.
Insights also take space in the ThoughtSpot installation. A lot of people creating insights can add up to a lot of data lying around. Just as water rising in a bath tub can overflow or just cause a problem you have to wade through, too much data can create a lot of old reports to sift through.
Another reason to expire an insight is time. Typically, business data is changing every day if not more frequently. Any particular set of insights are valid for data during a specific period of time. This doesn’t mean old insights can’t provide information you can use, just that you are unlikely to get the same insight twice.
If a set of insights look good, you can Save them and they are not removed
when they expire. Do this now, click ![]() > Save:
> Save:
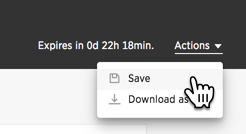
Now your insights won’t expire as you work with them!
Data outliers
SpotIQ attempts to look for three central insights. The first insight it looks for are data outliers. An outlier is a value that is “far away” or that differs from the other data.
Outliers can result from measurement or recording errors or they could contain valuable information. For example, one store might sell significantly more towels in one week out of the year because there was a flood that week.
-
Scroll to the first carousel of data that SpotIQ created for you.
A carousel groups a set of visualizations on a page. You can use the arrows attached to a carousel to “page” through its contents.
-
Count the number of items in the carousel.
You should see that SpotIQ found two outliers.
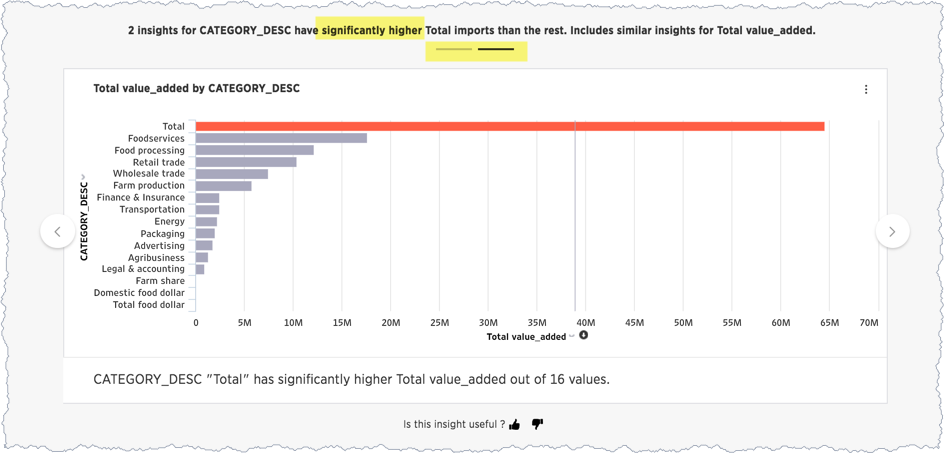
In this case, SpotIQ is indicating that the Total Imports value is significantly higher than the other values in your set.
Two facts about this outlier shouldn’t surprise, you. The first fact is that a total exceeds all the other items in the data. That just makes sense so this isn’t a true outlier.
The second fact is that SpotIQ insights are not always interesting. In this case the data included totals in the row data which caused nonsense outliers. You can use SpotIQ to fix this issue and go further. More about this later in the tutorial.
Looking for relationships (cross-correlation analysis)
The second category of insights SpotIQ attempts to find is cross-correlations. Cross-correlation looks for and measures relationships between two quantitive, continous information sets – in our case two fields (columns) in our dataset. Usually, you can see a cross-correlation in your insights if your data includes time or date data.
The result of a correlation analysis shows how strong and in what direction a relationship between two data sets moves. The range is -1 to 1, the closer the cross-correlation value is to 1, the more closely the information fields (data elements) are correlated.
- Scroll down your insight page, till you find the correlation results:
-
Page through the correlation category to the third insight:
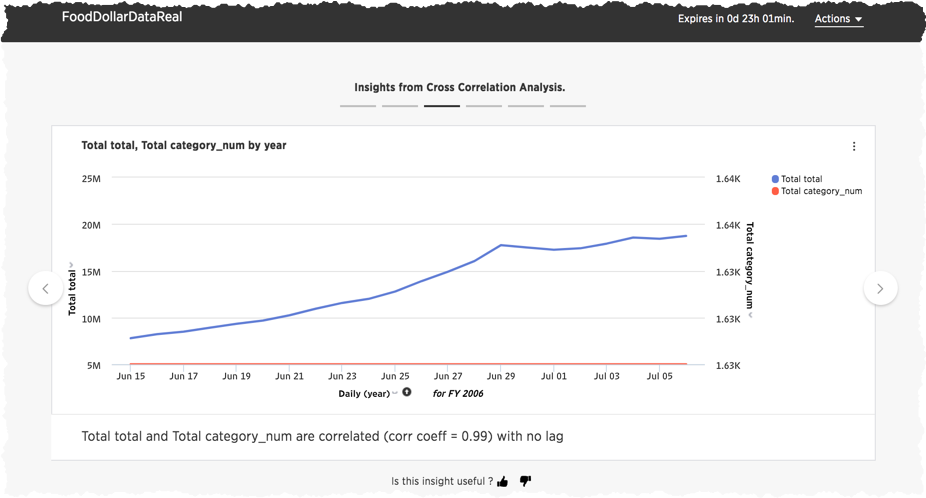
You can see that the over all total and the total category number values correlate very strongly. The correlation also looks for a lag value.
In the business world the dependence of a variable Y (the dependent variable) on another variable X (the explanatory variable) is rarely instantaneous. Often, Y responds to X after a certain lapse of time. Such a lapse of time is called a lag. Good Data Help.
Trends over time
The third set of insights SpotIQ looks for is a trendline. A trendline is a straight or curved line that indicates the general pattern or direction of a time series data (information in sequence over time). As you may have guessed, trendlines rely on your data having a date or time column.
You can use a trendline to determine the general direction of a trend in your data. Are sales are climbing or are customers are declining over time?
- Scroll down to the Insights from Trend Analysis section.
-
Look for the Total imports by year result.
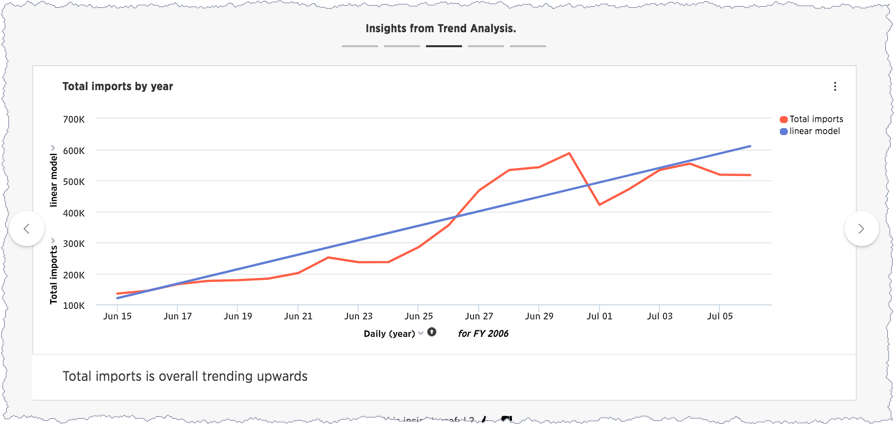
At this point, you may have noticed that SpotIQ grouped each type of insights. Outliers, correlations, and this last one, trendlines. This grouping makes it easier to locate and review similar types of insights.
Where to go next
In this section, you explored some of the functionality of the SpotIQ page. You learned that SpotIQ combines columns in your data to look for three categories of insights:
- outliers
- cross-correlations
- trendlines
In the next section, learn how to schedule SpotIQ to regularly deliver insights.