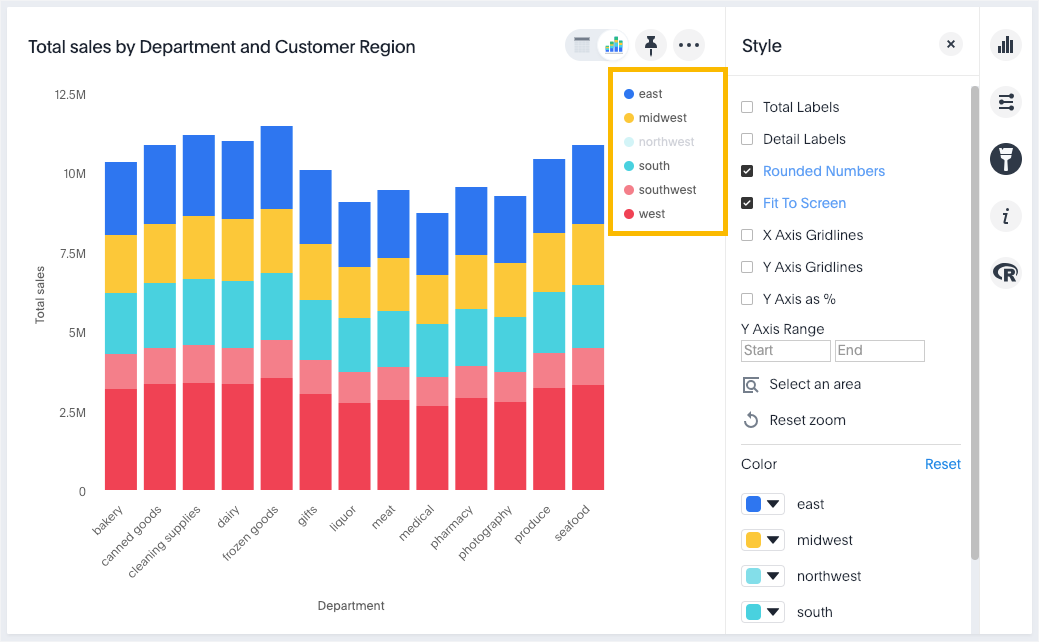
You can hide and show values on the chart using the legend.
Clicking on a legend item will hide it from the chart. You can click it again to show it. To hide and show values:
-
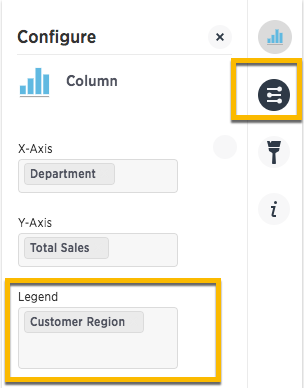
While viewing your answer as a chart, click Edit chart configuration on the right.

-
Make sure you have a column in the Legend field.

-
On the chart, click the legend value you would like to hide. Click the hidden legend value again to show it.
In the following example, we clicked
northwestto hide it.