R is a popular open source programming language for statistical computing, machine learning, and AI. ThoughtSpot makes R analysis available as a fully integrated feature in version 5.0
Using R in ThoughtSpot
While the ability to run custom R scripts on ThoughtSpot data was available in previous releases through SpotIQ custom analysis, starting with version 5.0 users with R privileges can run R scripts directly on search results.
Analysts and data scientists proficient in R can create and share custom scripts.
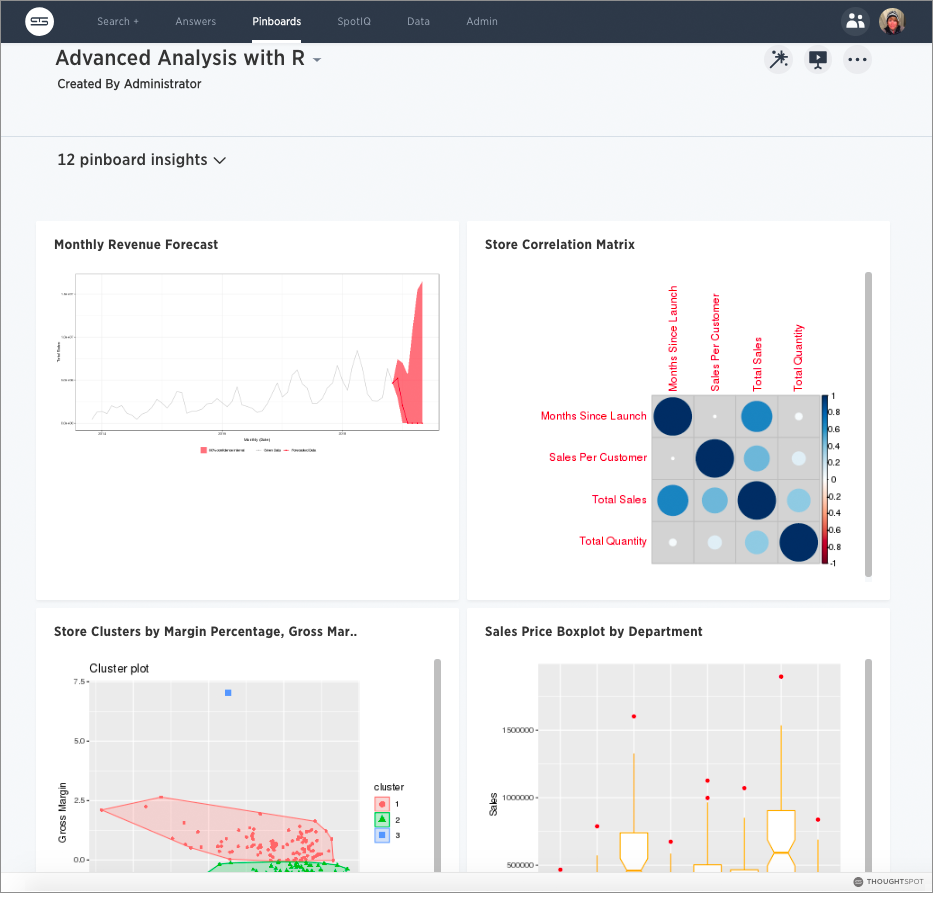
Users can leverage custom scripts and ThoughtSpot provided scripts, run pre-built R scripts on top of their search results, and share R visualizations as answers and pinboards.
This topic explains how to use R in ThoughtSpot both from an end user and scripting perspective, but is not meant as an R primer.
How to access R scripts
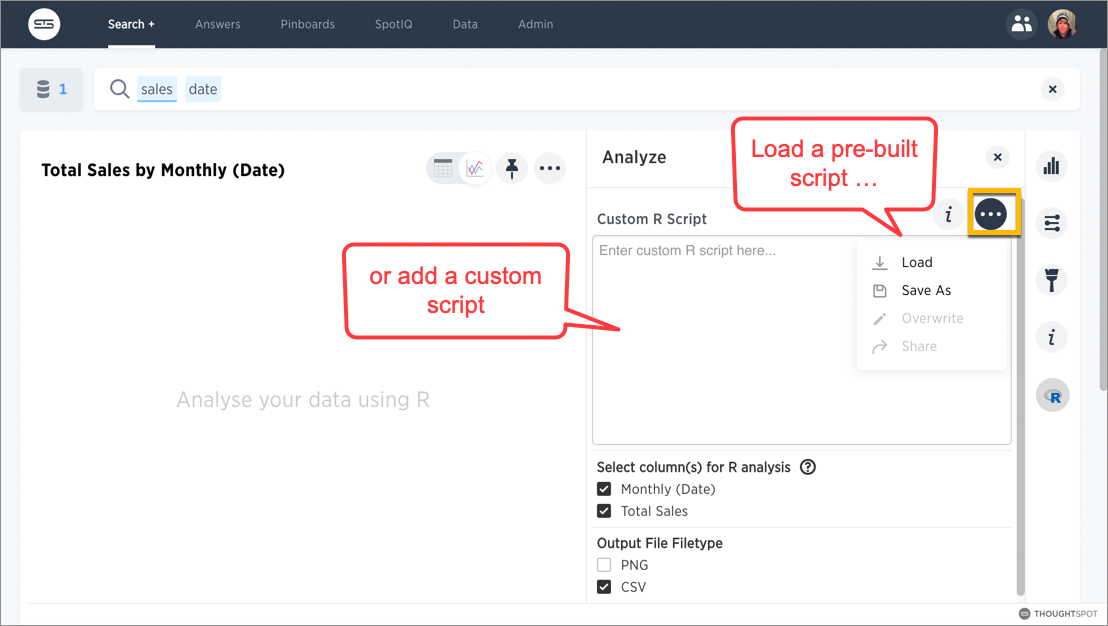
Users with R script privileges can click the R icon
![]() on the toolbar for any search result (answer).
on the toolbar for any search result (answer).
![]()
From here, you have options to write a custom script, or load a pre-built or ThoughtSpot provided script.

Run pre-built R scripts
You don’t have to have a background in statistics or be an R programmer to run R analyses in ThoughtSpot. You can use ThoughtSpot-provided scripts and share the R visualizations with others.
For more on how to run provided scripts, skip to Run pre-built R scripts on answers
Write your own R scripts in ThoughtSpot
If you know R, you can write your own custom scripts, share them as templates, test and run them on your data in ThoughtSpot, and build up a shared library of R analyses, scripts, visualizations, and pinboards.
Start with the topic on how to Create and share R scripts to learn more about writing R scripts in ThoughtSpot, including a few particulars on syntax and column bindings.
To learn more about R programming in general, a good place to start is R Project for Statistical Computing. Also, Anthony Chen’s blog post on Using R Analysis in ThoughtSpot for Time Series Forecasting is a nice introduction to writing R scripts in ThoughtSpot.
