The SpotIQ feature works without you having to do anything but pushing a button. However, like any other feature, there things you can do to optimize the feature. This page contains some best practices you can use to make SpotIQ more effective when you use it.
When to invoke SpotIQ
If you followed the tutorial, you know that right after uploading data is a good time to run Auto Analyze. SpotIQ can very quickly help you find insights in your data.
Start from a Search. Enter a single measure in the bar; one you want to explore of course! Then, choose Actions > Auto Analyze on the results. Choosing the single measure focuses SpotIQ.
Use Custom Analyze to focus or tweak the SpotIQ results. While you are tempted to keep all the columns, eliminating some can also result in a better analysis.
Do your data modeling
You can increase the SpotIQ’s effectiveness by ensuring you are practicing good data modeling. This is true if you are user uploading the occasional data file or a data management professional. Modeling data requires that you can:
-
Click Data to get to the data management listing.
-
Click a data source you own or can edit.
This brings up the Columns screen, where you can make your modeling settings.
-
Modify one or more column settings.
-
Save your changes.
If you worked through the SpotIQ tutorial, you can try experiment on the FoodDollarDataReal data you uploaded.
Make sure you set the INDEX PRIORITY for columns in your data source. Use a value between 8-10 for important columns to improve their search ranking. Use 1-3 for low priority columns. INDEX PRIORITY impacts user-based ranking which helps SpotIQ focus its analysis.
SpotIQ uses measures for correlations. For trendlines and outliers, if SpotIQ has a measure, it then drills by attributes in turn.

You should also set AGGREGATION on your columns. SpotIQ applies the default aggregations from your data when it pulls measures for analysis.
Situations to avoid
Like any AI, some situations SpotIQ is not yet equip to handle. You should know
what these are so you can avoid them. If your data contains a measure that uses
a MOVING_* or GROUP_* formula, SpotIQ may return results that simply aren’t
meaningful. When doing a correlation analysis, SpotIQ may not find meaningful
data if you have a measure with anything other than SUM.
Set SpotIQ preferences
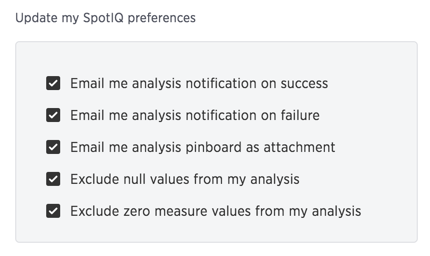
You can set preferences for SpotIQ in your user profile. These preferences allow you to control how you receive analysis notifications. They also allow you to exclude nulls or zero value measures from analysis.

The exclusions impact each SpotIQ analysis. It eliminates points with such values during statistical calculations for example, for mean, standard deviation SpotIQ excludes values from any equation and uses only the remaining points.
Prioritizing analyses types
You can prioritize highlighting changes in data over time instead of other changes, such as outliers or anomalies.
Columns
When you trigger a SpotIQ analysis on an answer, you can select alternate data columns. To trigger more time-related insights, pick more date-time columns.
Advanced
In the advanced tab of the SpotIQ dialog, increase the maximum number of trend and correlation insights, and reduce the number of anomaly insights.