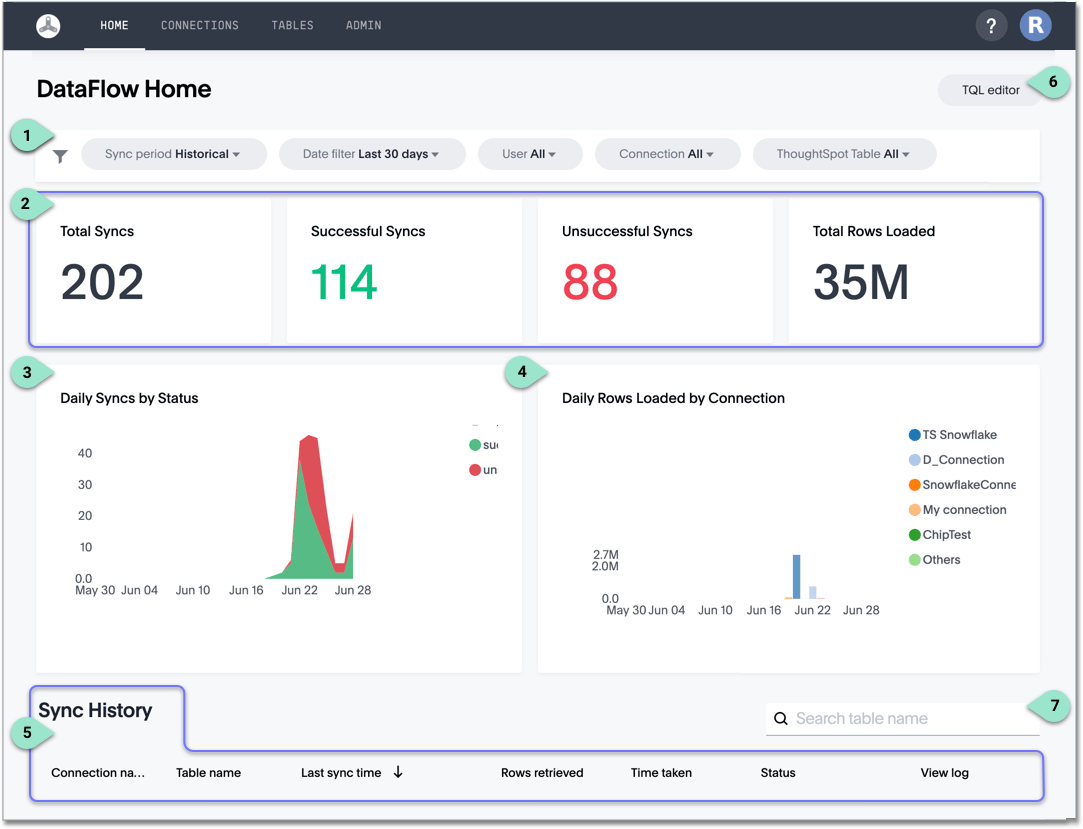
With a single glance, the Home interface for Dataflow reports the sync performance across your entire organization.

-
The filters include the following:
- Sync period:
-
Historical (default) display includes the sync count, graphs, and charts.
-
Upcoming display shows the list of connections that include the following columns: Connection name, Table name, Next scheduled run, Repeat, and Last run time details. The date filter and the graphs details are not visible.
-
- Date filter: Last 24 hours, Last 7 days, Last 30 days(default), or All time
- User: All or individual users
- Connection: All or individual connections
- ThoughtSpot Table: All or individual
- Sync period:
-
Key indicators:
- Total Syncs
- Successful Syncs
- Unsuccessful Syncs
- Total Rows Loaded
-
Daily Syncs by Status is an Area chart that shows In Progress, Successful, and Unsuccessful syncs over time.
-
Daily Rows Loaded by Connection is a column chart that shows the number of rows loaded for each connection over time.
-
Sync History reports the following information for all connections:
- Connection name
- Table name
- Last sync time
- Rows retrieved
- Time taken
- Status
- View log
-
TQL editor enables users to enter DDL commands to run on the internal database, such us
CREATE DATABSE ...and similar. -
Search enables users to find information on specific tables, by name.